查看更多
密码过期或已经不安全,请修改密码
修改密码
壹生身份认证协议书
同意
拒绝

同意
拒绝

同意
不同意并跳过


作者:香港中文大学妇产科学系 史蒙蒙

Stroke & Vascular Neurology(SVN)最新上线文章“Genome sequencing reveals the role of rare genomic variants in Chinese patients with symptomatic intracranial atherosclerotic disease”,来自我国香港中文大学妇产科学系董梓瑞、内科及药物治疗学系Thomas W Leung(共同通讯作者)团队。
颅内动脉粥样硬化性疾病(intracranial atherosclerotic disease, ICAD)是引起缺血性卒中的常见原因。ICAD具有种族易感性,与高加索人群相比,ICAD在亚裔和非裔中更为普遍,这提示了遗传缺陷可能是导致ICAD的原因之一。然而,目前ICAD的遗传病因仍不明晰。尽管既往全基因关联分析揭示了数个与ICAD潜在相关的单核苷酸多态性(single nucleotide polymorphism, SNP),但绝大多数与ICAD的关联性很弱,且未有对其致病机理的讨论。相反,有研究提示,部分可引发ICAD的血管危险因素(如高血压、糖尿病、脂代谢异常)及其他与ICAD存在部分共同病理机制的卒中(如脑小血管病),可由单基因遗传病引起。此类致病机制可能为探究ICAD的遗传病因学打开一扇新的大门。
近期,已有几个样本量较小的队列研究(少于30个样本/家系)利用外显子组测序技术揭示了罕见的基因组变异可能与卒中存在潜在相关性。然而,目前仍没有针对ICAD相关卒中队列的遗传学探究。因此,本研究利用全基因组测序技术(whole genome sequencing, WGS)初步探究罕见基因组变异在中国人群ICAD中的作用。
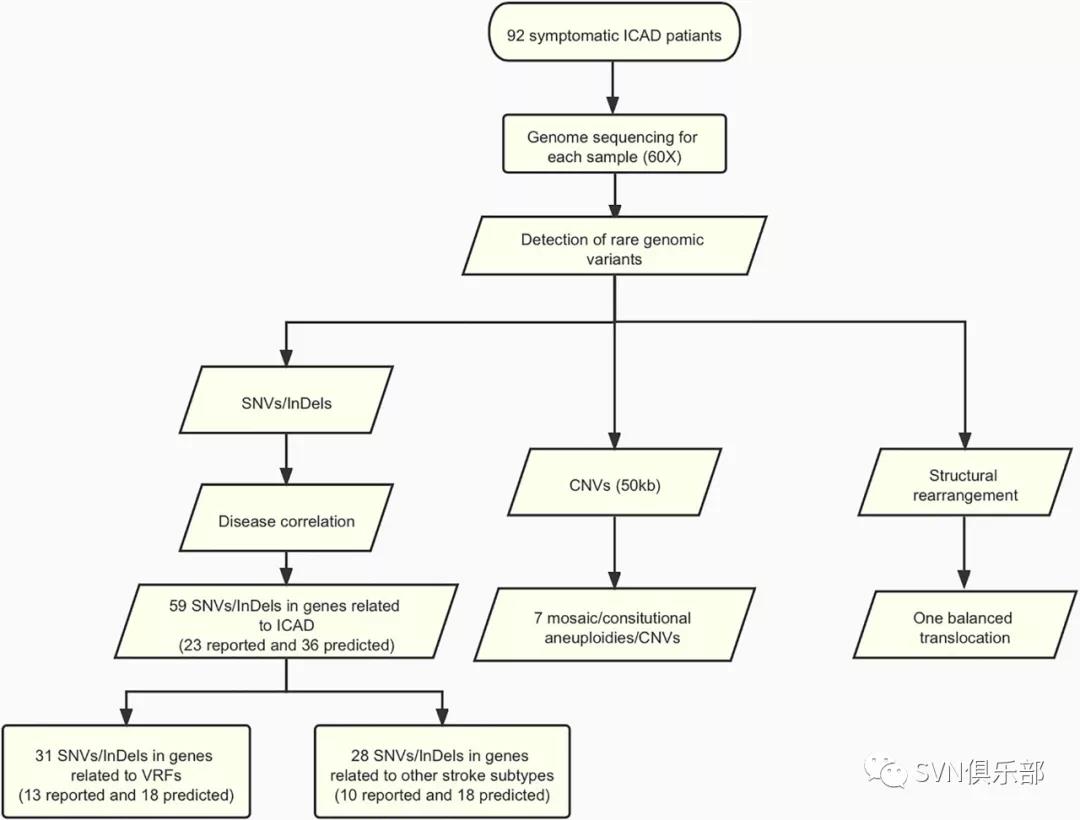
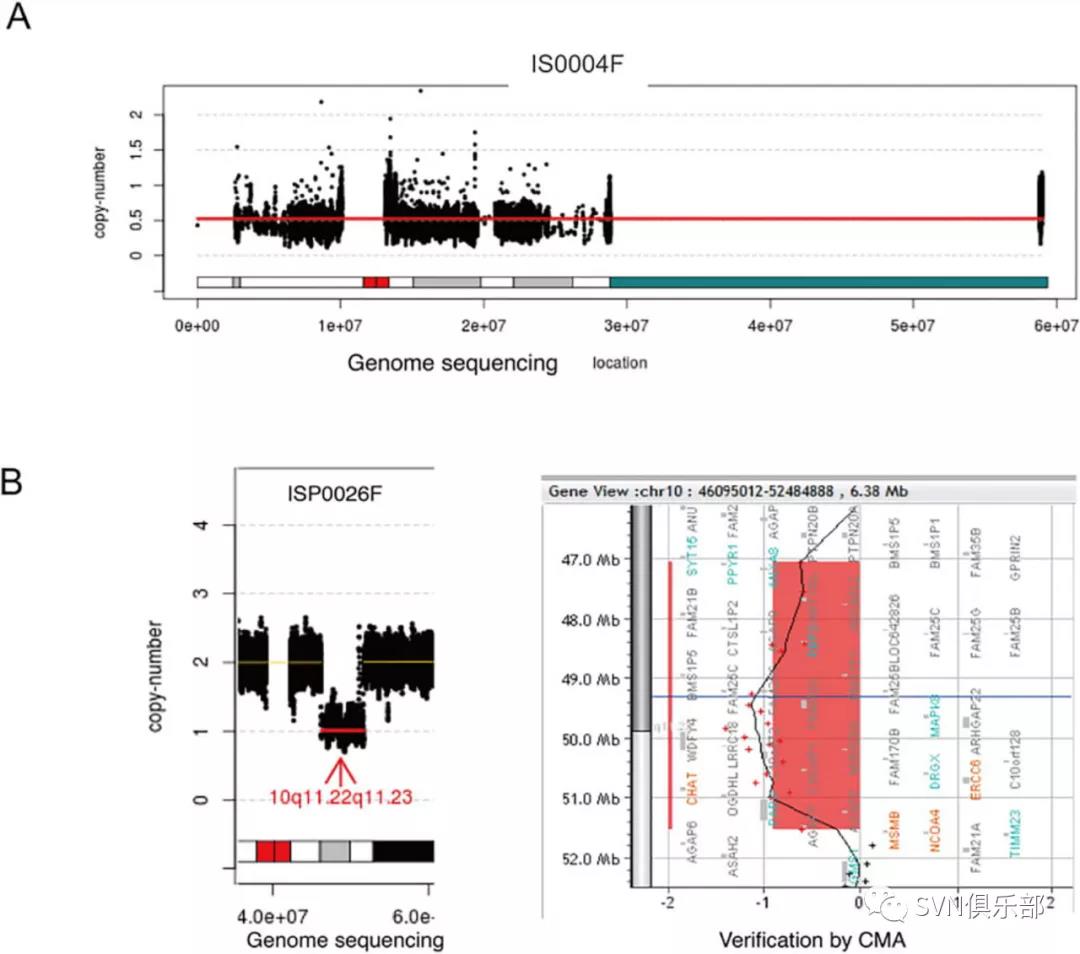
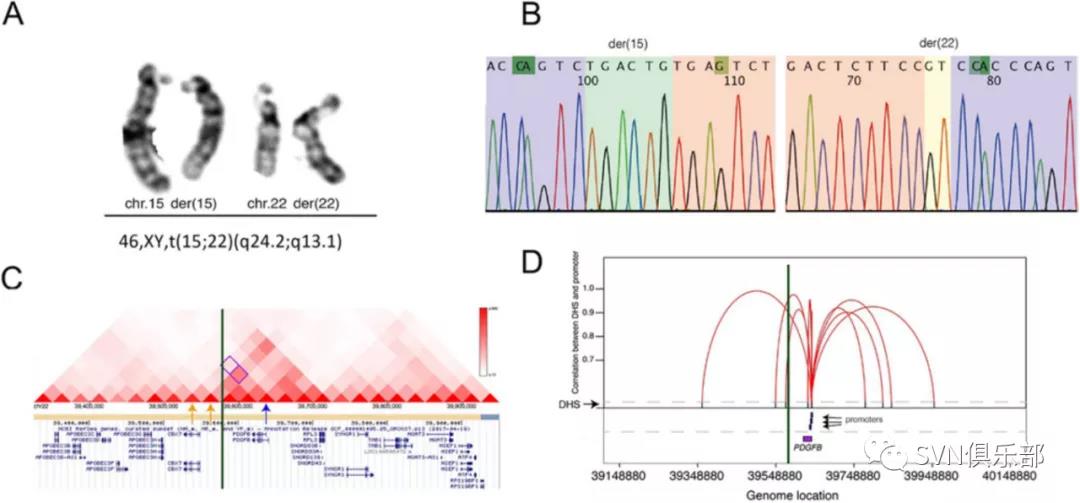
本研究纳入了92例症状性ICAD患者,利用WGS对基因组变异包括单核苷酸变异(single-nucleotide variant, SNV)、微小缺失或插入(small insertion/deletion, InDel)、拷贝数变异(copy number variant, CNV)及染色体结构异常进行全面分析(Figure 1),并讨论与已知导致血管危险因素或其他类型卒中相关的基因组变异及其致病机理;最后,研究团队对候选基因进行通路富集。通过WGS,在48例患者(52.2%)中发现了59个罕见的已报道或预测致病的SNVs/InDels,其中31个位点所在基因与血管危险因素有关,28个所在基因与其他类型卒中有关。同时,在8例患者(8.7%)中发现了7个罕见的CNV(Figure 2)和1个染色体结构变异(Figure 3)。最后,通过通路富集分析,研究团队发现这些候选基因与脂蛋白代谢和分解有关。

Figure 1 Flowchart of this study. Detailed methods and results are described in the main text. A total of 92 patients with symptomatic ICAD were submitted to genome sequencing (60-folds). Variant analysis was performed and identified 59 SNVs/InDels (23 reported and 36 predicted). In addition, genome-wide analysis revealed seven likely ICAD-related aneuploidies (loss of Y chromosome)/CNVs (>50 kb) and one balanced translocation.

Figure 2 CNVs detected by GS. (A) Mosaic aneuploidies (loss of Y chromosome) detected by GS: mosaic level is around 50%. The X-axis indicates the genomic location of chromosome Y in human genome reference (GRCh37/hg19), while the Y-axis shows the copy number of chromosome Y. The mean copy ratio is shown by the red line. (B) A 5 Mb constitutional heterozygous deletion in 10q11.22q11.23 detected by GS (shown in the left side) and confirmed by CMA (right side). In the left side, the X-axis indicates the genomic location of the human genome reference (GRCh37/hg19), while the Y-axis shows the copy number. The heterozygous deletion is indicated by a red line with a pair of an arrow and the band region shown in the bottom. In the right side, probe distribution on the CMA platform with the candidate region reported by low-pass GS highlighted in red.

Figure 3 Identification of a balanced translocation in one patient. (A) Validation result by G-banded chromosome analysis (karyotyping) suggested a balanced translocation: 46,XY,t(15;22)(q24.2;q13.1). (B) Sequencing chromatograms of the breakpoint junctions. Sequences (from Sanger sequencing) of chromosomes 15 and 22 are highlighted in purple and pink, respectively. Inserted sequences and microhomozygous involved in the breakpoint junctions of the derivative chromosomes are also highlighted in green and yellow, respectively. (C) Breakpoints likely disrupted topological associated domain involving the PDGFB gene. Visualisation () of interaction between gene PDGFB and the other locations in the reported database. Distribution of topological associated domains (triangles in different scales of red indicate different levels of interactions). The breakpoint junction is shown in the green vertical bar. The location of PDGFB gene is indicated by a blue arrow, while two windows potentially involved in the interaction of PDGFB gene are indicated by two yellow arrows. (D): disruption of the interactions between DHSs and promoters of PDGFB by the breakpoints. Figure indicates the diagram of the cross-cell-type correlation between distal DHSs and promoters of gene PDGFB based on the reported map. X axis represents the genomic coordinate of each element (such as gene and promoter), while Y axis shows the value of each correlation (r>0.9, reflected by a red line) between distal DHSs (indicated by the black bar) and promoters (blue bar) of gene PDGFB (purple box). The breakpoint junction is also shown in the vertical bar.
通过本研究,进一步提示了罕见基因组变异在中国人群中颅内动脉粥样硬化中的作用。

来源:SVN俱乐部
转载已获授权,其他账号转载请联系原账号
查看更多